-
What’s New
- 19 December, 2025 – Jira Integration, Matrix Progress, Mobile Experience, and Plan Overview Enhancements
- 5 December, 2025 – Enhanced Mobile Experience, Improved Collaboration Tools, and Platform Stability
- 30 October, 2025 – In‑Meeting Collaboration, Tags & Planner Sync, Checklists and Templates, and Matrix Improvements
- 30 September, 2025 – Combined Consent Form, Unified Sort Order, and Copilot Improvements
- 15 September 2025 – Enhanced Copilot Chat, Model Selection, and Permissions Update
- 16 July, 2025 – New Languages, Meeting Sharing, and Improved Onboarding
- 28 May 2025 - Improved In-Plan Copilot, new plan statistics and support for Outlook
- 17 April 2025 - Auto Create Sub Plans and Share OKRs in Plan Hierarchy
- 28 February 2025 - Comments feature and Enhanced Gantt Zooming
- 30 December 2024 – link to Objects, Delete plan connections, Library Upgrades, and Support for cloud.microsoft
- 4 October 2024 – VisPlan Copilot & User Rights Management
- 30 April 2024 – Visual Filter
- 12 April, 2024 – Excel Integration for OKRs
- 14 February 2024 – Exciting Updates: Introducing the E-bike Sample Plan, Improved OKR Structure, and Focus Dates
- 30 October 2023 - Improved alignment of Capability lines and bug fixes
- 2 October 2023 - New Feature: OKR View
- 21 August 2023 - Hierarchy View Feature
- 6 April 2023 - Matrix Upgrade, Sidebar Focus Grouping, and Organization Templates
- 3 March 2023 - Matrix Improvements, Assignee on Ambitions, Custom Thresholds, and Generate Gantt PDF
- 10 February 2023 - Faster Syncing with Microsoft Planner and Azure DevOps
- 12 Jan 2023 - DevOps Custom Work Item Types and Budget Key Result/KPI
- 5 Dec 2022 - Maintenance Release
- 22 Nov 2022 - Resize Drawing Area and Group Actions by Focus
- 8 Nov2022 - Assignees on objects and associate Focus with Key Result
- 28 Oct 2022 - Add Backgrounds and Move KPIs
- 22 Sep 2022 - Updated New Plan Wizard with Sample Plan and Text object
- 8 September 2022 - List View and Create New Plan Wizard
- 5 Jul 2022 - User interface and framework upgrades
- 7 Jun 2022 - Navigate to linked plan
- 27 May 2022 - OKRs, Focus improvement, Progress indicators and more
- 11 Apr 2022 – DevOps, Checklist view and Manual reload inherited data
- 15 Mar 2022 – Version History
- 25 Feb 2022 – All your plans in the Personal tab
- 31 Jan 2022 - Swedish language and Profile picture
- 26 Nov 2021 - New Gantt view and completed Actions
- 22 Oct 2021 - Integration with Microsoft Planner
- Show more... (21) Collapse Articles
-
Getting Started
-
Using VisPlan
- How to Use Tags in VisPlan
- How to Use In-meeting Collaboration with VisPlan in Microsoft Teams
- Manage VisPlan Hierarchy - Generate Sub Plans from Master Plan
- How to Disconnect and Delete a Microsoft Planner Plan Connected to VisPlan
- How to Delete a VisPlan Plan in Microsoft Teams
- The VisPlan Edit Mode: Optimizing Your Plan’s Visual Layout
- How to View All Actions Planned Between Two Dates in VisPlan
- How to use the List View
- How to use Excel for OKRs
- How to use the OKR View
- How to use the Hierarchy View
- How to Use Attachments in VisPlan
- Using the Matrix View
- Working with Capabilities and Ambitions
- Progress Calculations
-
FAQs
- Articles coming soon
-
Integrations
-
Other
Track your progress effectively with VisPlan’s Traffic Light indicator. This article delves into the calculations behind the indicator, providing examples and explaining the threshold for each color.
Learn how VisPlan helps you measure progress of Actions, Ambitions, and Capabilities and make informed decisions based on the data.
The Progress calculation determines the completion status of the objects by calculating the duration between the start and due dates. It includes all days, including weekends and holidays.
The Planned Percent Complete reflects the linear progression from the start to the end of the object. For more advanced tracking, we recommend using our built-in OKR (Key Result and KPI) measurements.
If the due date has passed, the status will automatically be set to Red.
Progress calculation for actions connected to external systems, such as Microsoft Planner, may differ in their measurement methods.
Status Colors
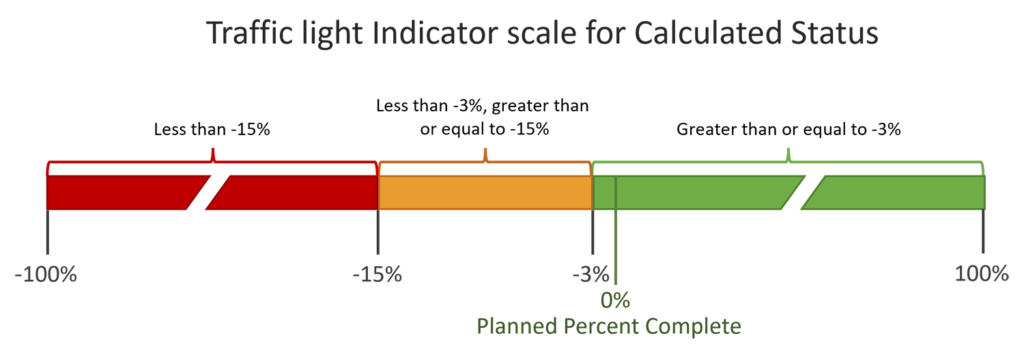
The Traffic Light indicator system uses red, yellow, and green colors to show the progress of the Actions, Ambitions, and Capabilities. The progress is compared to the planned percent completion, and the colors indicate how the current progress matches the plan
- Green : The current progress is better than or equal to 3% behind the plan. (Calculated Status ≥ -3%)
- Yellow : The current progress is between 3% and 15% behind the planned completion. ( – 15 % ≤ Calculated Status < -3% )
- Red : The current progress is more than 15% behind the planned completion (Calculated Status < -15 %)
Custom Thresholds
The default thresholds for the colors can be customized.
Go to Menu – Plan View Settings, and sett your own values. Default is Red -15% and Green -3%.
Yellow will be automatically set in between the Red and Green interval.
Progress on Actions
- The Action’s Progress is calculated by the Start Date, Due Date and the actual Percent Complete.
- Calculated Status = Percent Complete – Planned Percent Complete
- Elapsed days = Today – Start Date
- Duration = Due Date – Start Date
- Planned Percent Complete is Elapsed Days/Duration
Example
Today is 2023-01-13 (Jan 13)
Start Date is 2023-01-10 (JAN 10) , Due Date is 2023-01-19 (JAN 19) = 10 day duration.
Progress is set to 40 %
Planned Percent Complete is calculated to 30%
Calculated Status is 40-30 = 10% Green color
Progress on Ambitions
- The Ambition’s progress is calculated by using the underlaying Action’s properties
Average Percent Complete and an average of each Action’s Planned Percent
Complete. - Elapsed days = Today – Start Date
- Duration = Due Date – Start Date
- Planned Percent Complete is an average of each Action’s Planned Percent Complete.
- The Calculated Status is Average Percent Complete – Planned Percent Complete
Example
Today is 2023-01-13 (JAN 13)
Action 1:
Start Date is 2023-01-10 , Due Date is 2023-01-19
Progress is set to 40%
Planned Percent Complete is 30%
Calculated status 40-30= +10% Green color
Action 2:
Start Date is 2023-01-01 , Due Date is 2023-01-20
Progress 20%
Planned Percent Complete is 60%,
Calculated Status 20-60=-40% Red Color
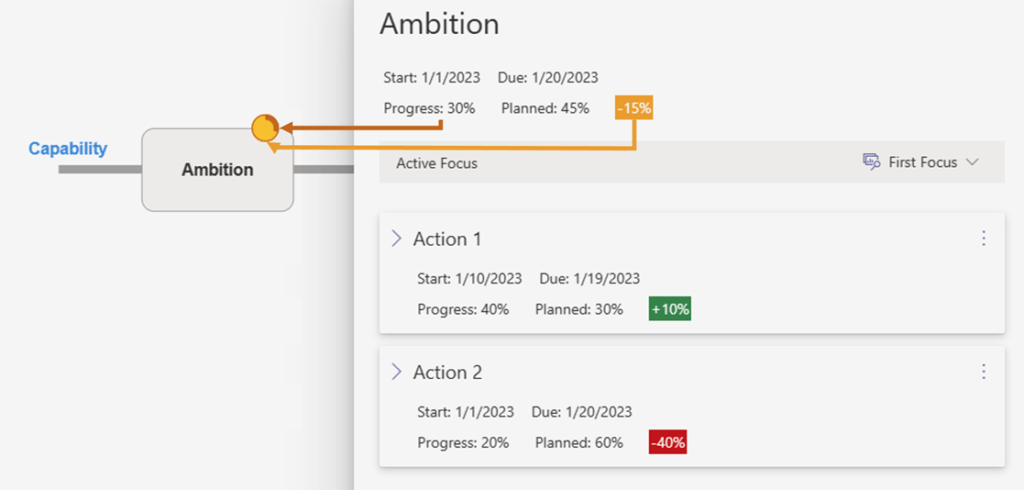
The Ambition inherits the value from both its Actions;
Start Date 2023-01-01 , Due Date 2023-01-20 ,
Average Percent Complete ((40+20)/2) = 30%
Planned Percent Complete (30+60)/2= 45 %
Calculated Status 30-45 = -15 %, Yellow color for the Ambition
The Ambition’s indicator has the color of the Calculated status (Yellow), and the outer ring represents the Progress (30%).
Progress on Capabilities
- The Capability’s status is calculated by the Start Date, Due Date and the Percent Complete of all Ambitions on its line.
- Average Percent Complete – Planned Percent Complete
- Elapsed days = Today – Start Date
- Duration = Due Date – Start Date
- Planned Percent Complete is an average of each Ambition’s Planned Percent Complete
The Calculated Status is Average Percent Complete – Planned Percent Complete
Example
Today is 2023-01-13 (JAN 13)
Ambition
Start Date 2022-01-01 Due Date 2023-01-20
Progress 30%
Planned Percent Complete 45%
Calculated Status 30-45=-15% Yellow color
Ambition2
Start Date 2023-01-01 Due Date 2023-01-30
Progress 40%,
Planned Percent Complete 40 %
Calculated Status 40-40= 0% Green color
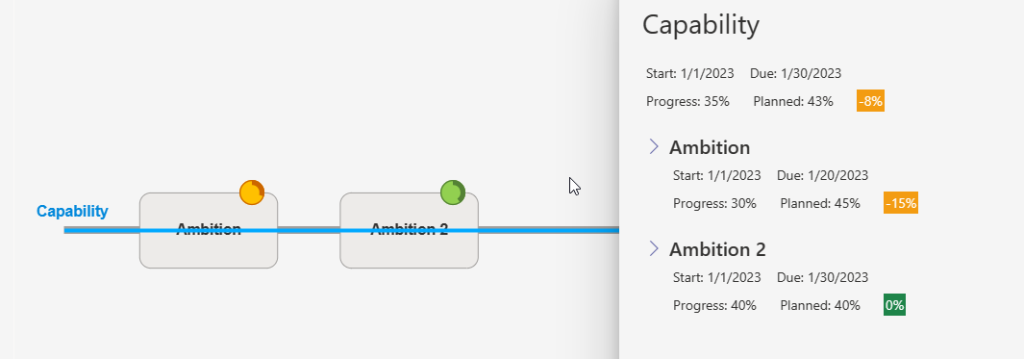
Capability = Ambition + Ambition 2
Start Date: 2023-01-01 Due Date 2023-01-30
Average Percent Complete (30+40)/2= 35 %
Planned Percent Complete (45+40)/2=42,5 ≈ 43
Calculated Status 35-43= -8 % and the Yellow color


