
Using the Matrix View
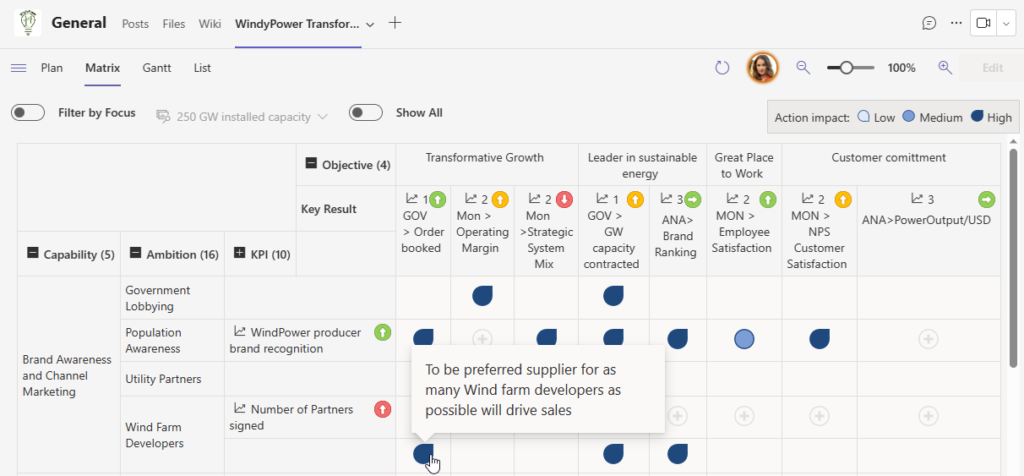
Additionally, the Matrix incorporates traffic light color-coded indicators to track the status of Key Results, providing valuable insights into deviations from target values and trend analysis.
The left side of the Matrix presents the visual plan objects arranged in a hierarchical order, encompassing Capability, Ambition, KPI, and Actions. This structured layout allows for clear organization and understanding of the various components within the plan.
Moving to the top of the Matrix, you will find the Strategic Objectives and their corresponding Key Results. This horizontal placement highlights the alignment between these objectives and the actions taken to achieve them.
Validation Indicators
Within the Matrix, the blue teardrops or dots represent the validations established between an Action and a Strategic Objective, potentially including a Key Result. These validations are categorized as having a High, Medium, or Low impact, providing an assessment of their significance.

Key Results – Traffic Light Indicators
In addition to the validations, you will notice colored indicators adjacent to each Key Result.
These indicators adopt the familiar Red, Yellow, and Green color-coding, akin to the Progress indicators. They indicate the degree of deviation from the specified target values. Moreover, an arrow symbolizes the trend based on the last two entered values.
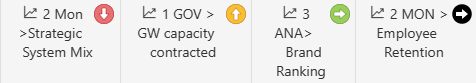
A black indicator signifies the absence of a specified value, while a right-pointing arrow suggests no change between the last two actual values.
By combining visual representation, hierarchical organization, and status indicators, the Matrix delivers a comprehensive and insightful perspective on the relationships and progress within your strategic plan.
Expand and Collapse Columns: Customize Your View
By simply clicking on the + /- icon, you can expand or collapse columns according to your preference.
By default, the columns are expanded up to the KPI level, providing a broad overview of your strategic plan. However, if you want to explore he underlying Actions, you can simply expand the KPI level to reveal all associated Actions.
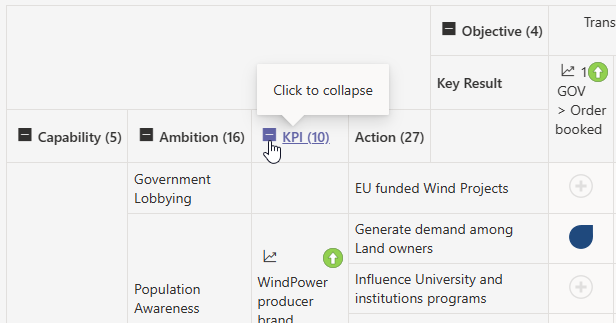
On the other hand, if you prefer a more condensed view, you have the option to collapse a column. In this case, the Matrix will intelligently aggregate the values and display an icon representing the average for the validations.
This allows you to navigate and analyze your Matrix with ease, tailoring it to your specific needs. Gain valuable insights and make informed decisions by adjusting the level of detail at your fingertips.
Key Result vs. KPI chart
By clicking on the and intersection and choosing “Show Chart”, you can view the correlations between the KPIs and Key Results in a single graph, allowing for easy comparison between the two.
Each data series is assigned a unique color, making it easy to distinguish between them.
If you collapse the columns, the comparison graph will include even more data series, providing additional insights and analysis.
Filter by Focuses: Customize Your Perspective
By selecting a specific focus, you can narrow down the Matrix to display only the Actions assigned to that particular focus. This functionality allows you to prioritize and assess what is important during different time intervals.
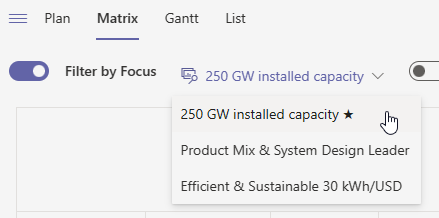
Please note that an Action can only be associated with one focus at a time, and the duration of an Action does not automatically assign it to a specific focus. Tailor your view to align with your current priorities and gain clarity on the actions that matter most.
Show All: See everything and Create New Validations
The “Show All” option allows you to view all Actions that currently have no validations linked to a Strategic Objective or Key Result. It visualizes areas that might require attention or further validation.
Moreover, you can conveniently create new validations directly within this view by simply clicking on the “+” sign.
When a validation is made at the KPI level, all underlying Actions inherit the same value, providing a streamlined approach. However, you still have the flexibility to adjust individual Action values as needed, empowering you with granular control over your strategic planning process.
Harness the Power of the Matrix View
The Matrix view is a powerful tool that unlocks a wealth of insights and enables effective strategic planning. Here’s how you can make the most of its features:
Overall Distribution: Gain a visual representation of how well your current set of actions aligns with your defined strategic objectives. The Matrix provides a clear overview of the distribution, allowing you to assess the strategic alignment of your actions at a glance.
Identifying Gaps
Identify areas where strategic objectives lack associated actions or have only a few. This serves as a prompt to create additional actions or revisit the objectives themselves for further discussion. By addressing these gaps, you can ensure comprehensive coverage and a more robust strategic plan.
Prioritization
When a strategic objective is linked to numerous actions, the Matrix helps you prioritize which actions will have the most significant impact. This becomes especially crucial when certain actions are associated with multiple strategic objectives. By focusing on prioritized actions, you can maximize the benefits and optimize your strategic outcomes.
Objectives Alignment
A densely populated Matrix, where most actions are associated with multiple strategic objectives, highlights potential overlaps or similarities among the objectives. This insight prompts a deeper examination of objective alignment and allows you to refine and streamline your strategic focus.
Uncover Hidden Complexities
The Matrix provides unique insights that may be challenging to capture through other views. It sheds light on hidden complexities within the action development process, helping you identify interdependencies, potential bottlenecks, and areas that require further attention or adjustment.
Enhance Clarity with ‘Why’ Validations
Adding a clear ‘Why’ when making validations enhances understanding and ensures clarity for others, even at a later point in time. It provides context and rationale for the associations made between actions and strategic objectives, facilitating collaboration and knowledge sharing.
Unlock the full potential of your strategic planning process with the Matrix view. Leverage its comprehensive insights, identify gaps, prioritize actions, align objectives, and enhance clarity for seamless collaboration and strategic success.