There’s a better way.
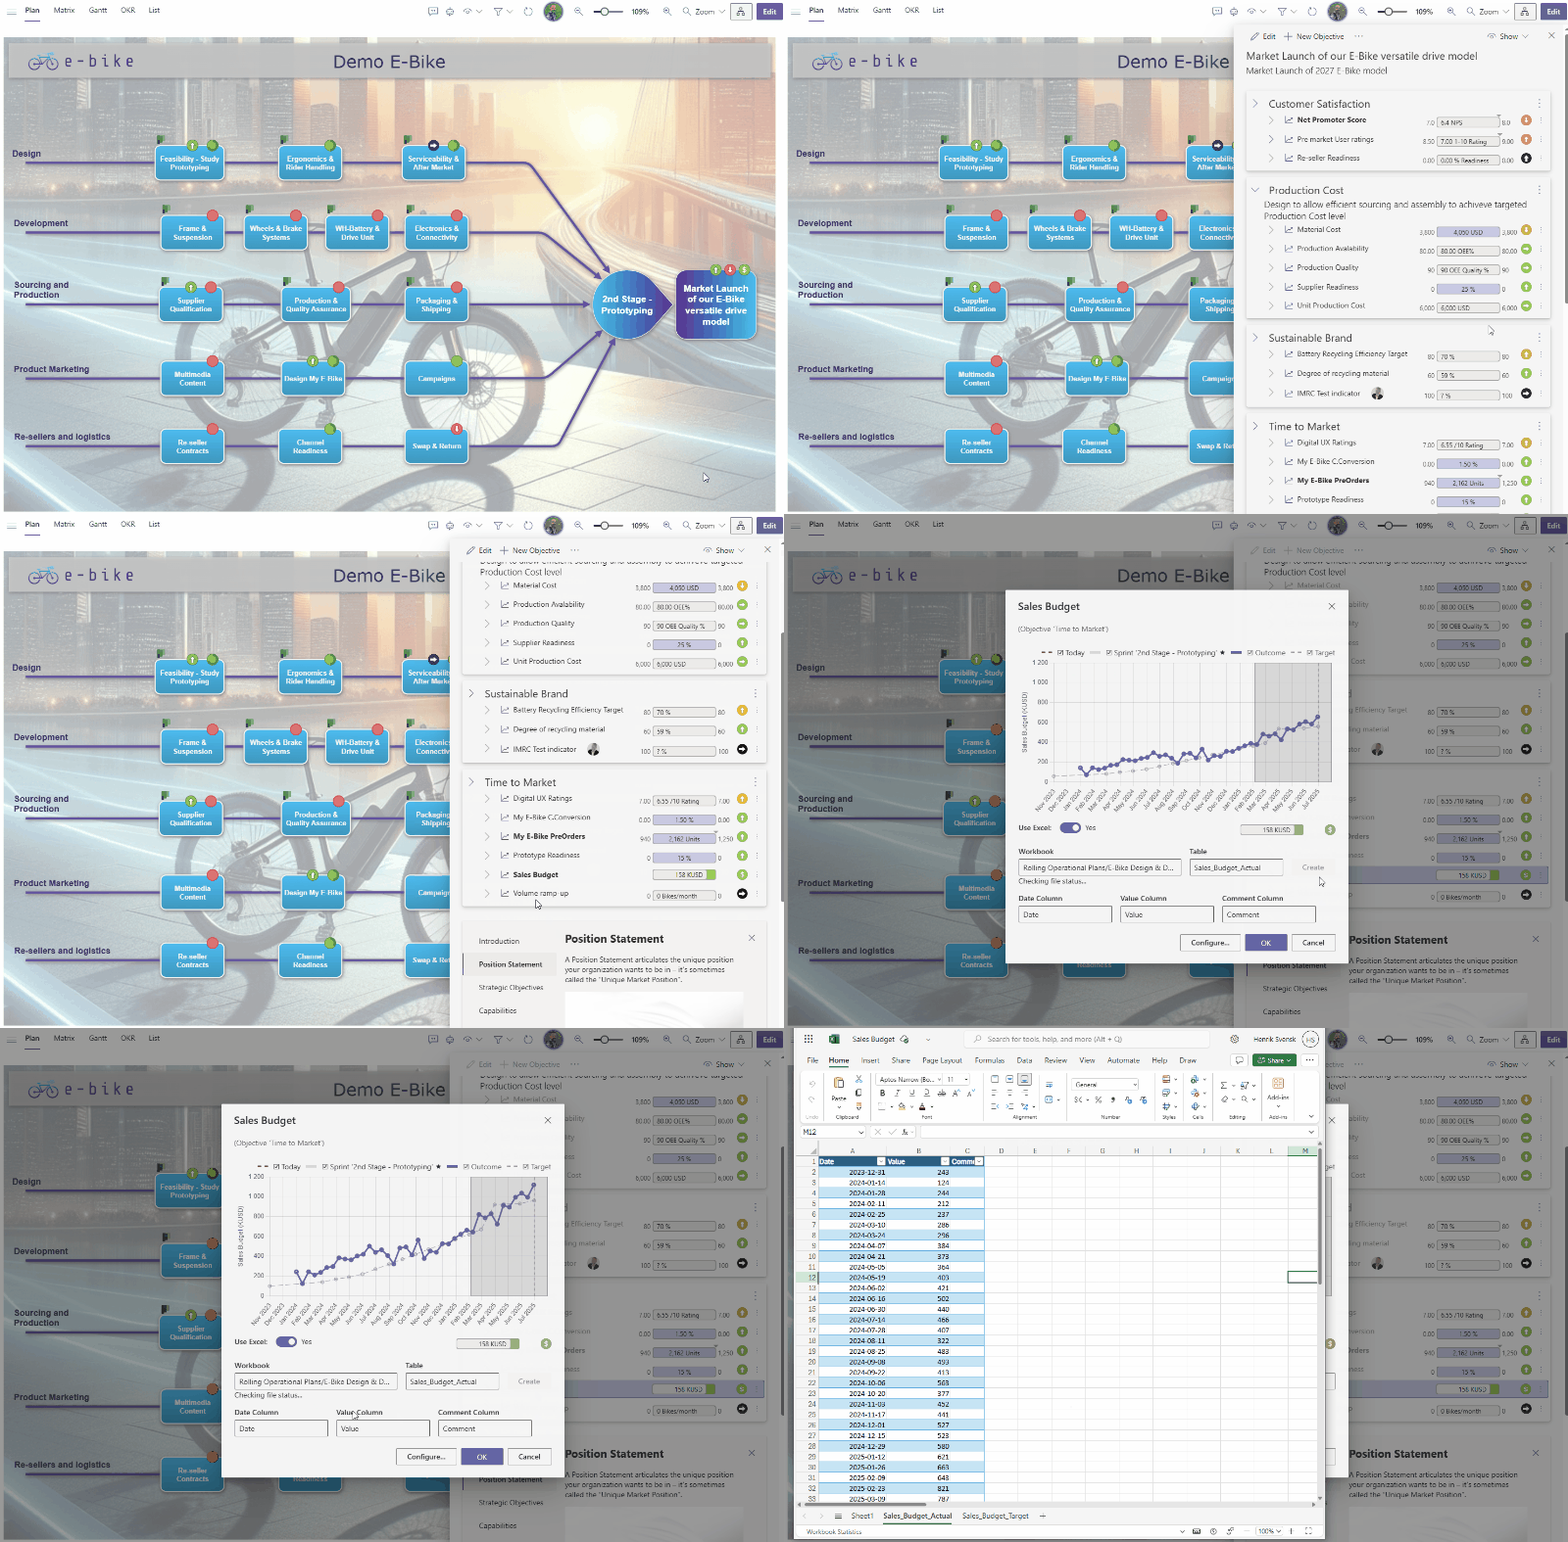
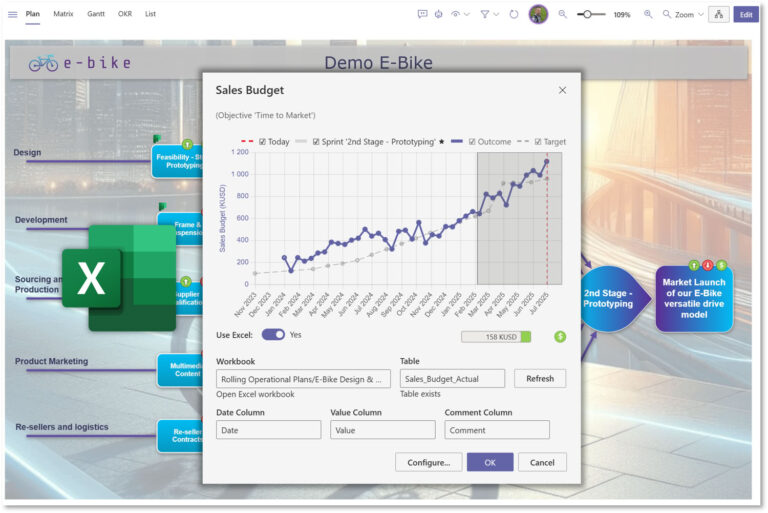
Now, you can connect Excel workbook tables directly to Objectives and KPIs in Visplan — and instantly make your result data visual, structured, and briefing-ready inside Microsoft Teams.
Whether you’re tracking sales performance, operational KPIs, or financial targets, your data stays live, accurate, and aligned — no formatting required.

Watch how to connect Excel to VisPlan and bring real-time business data into your business plans.
See how it works — and upgrade your next KPI briefing.
In this comprehensive tutorial, dive into the world of VisPlan and learn how to optimize your OKR (Objectives and Key Results) management using the Excel Connector feature. Whether you’re a project manager, team leader, or data analyst, mastering the VisPlan Excel OKR Connector can revolutionize the way you track, analyze, and visualize your goals and performance metrics.
If you have any questions or need assistance getting started, feel free to reach out to us directly.
Looking forward to seeing the amazing plans you’ll create with VisPlan!

